Open Energy Monitor and home automation
With this post I would like to start putting some content online again, and what better argument than what has been occupying my (really scarce) spare time in the last months.
I'll start with what I wanted to achieve with my home automation project:
- Have fun :)
- Monitor home energy consumption
- Detect 'Rogue' energy usages
- Have an early warning system for my flood pumps in the basement/garage because when they fail I have anywhere from 5 to 50 cms of water inside when all is said and done.
- Avoid spending thousands of Euro to accomplish the project
Mainly because of the last point, but also because of the potential complexity of finding an existing system that would allow me to achieve all my stated goals, the choice on what hardware and possibly software could be used left the project in a "Would like to do it but it costs too much" state for some time, until I stumbled on the OpenEnergyMonitor web site, that is.
OpenEnergyMonitor is a project to develop open-source energy monitoring tools to help us relate to our use of energy, our energy systems and the challenge of sustainable energy. (direct quote from the website)
The project consists of various building blocks, a mix of hardware and software components geared towards collecting energy consumption data (and more in general, data) , transmitting it to a central node for processing, displaying and eventually generate alerts based on predetermined rules.
All of this is accomplished using a completely open sourced design, both on the hardware and the software side, mainly Arduino hardware for the data collection, and a linux platform for processing and displaying the data. Also, by design the project avoids potentially dangerous situations that can arise when one mixes current, sensors, not exactly professional setups and some wiring .....
After perusing the forums, the shop, the forums, the shop .... anyway, after a lot of pondering, I decided I could part with a not too big amount of money and ordered:
- Two emonTx nodes
- Six Current Transformers (CTs): sensors that are able to measure current flow without being physically connected to any part of the electric circuit
- Two AC-AC transformers: needed to sample the actual voltage from the electrical line in order to be able to calculate the correct amount of power in conjunction with the CTs measurements
- Two Temperature sensors
- One Raspberry pi to act as emonBase node: used to collect sensor data, host a local instance of emoncms, the project custom developed software to collect and display sensors data
- One RFM12b wireless module used to enable the raspberry to receive wireless data from the emonTx nodes
The original plan for the project was to have
- one emonTx node near the utility meter, used to monitor global home energy consumption and also two other values:
- Energy consumed by all things connected to my main UPS (I have lots of them)
- Energy consumed by the rest of the house electric appliances
- one emonTx node near the electric panel that provides power to the flood pumps, used to monitor the (eventual) energy consumption of the two pumps
- one emonBase node to collect and process energy consumption data and raise alerts whenever the pumps were switched on
As in all DIY projects the plan underwent some small modifications and I ended up adding:
- one RFM01 receiving module to the raspberry to enable it to receive additional weather sensor data
- multiple weather sensors (part of a WH1080 weather station) to store weather data and be able to correlate precipitation data with pump activations
- a weather station data collecting tool on the raspberry (Swpi), used to collect the data and forward it both to the local emoncms instance and to a separate weather-oriented tool to display weather graps (WuGraphs)
- a separate arduino board named rboard to monitor water level and drive pump activation, connected to one emontx node through I2C to send activity data to the emonbase
- a din rail 220v to 5v transformer to be able to power one emontx node, the rboard, and the separate circuitry on the rboard that drives the relays: this allowed me to save some space and reduce the number of AC-DC transformers involved and also allowed me to have a more weather resistant setup (it's in a basement garage) without exposed (albeit 5v) connections
- two float switches to drive pump activation
I also ended up contributing in small part to both the emoncms project by adding some features to the module that sends alerts, and also to the weather station software by writing the necessary plugins to send weather data to emoncms and to the weather data display software
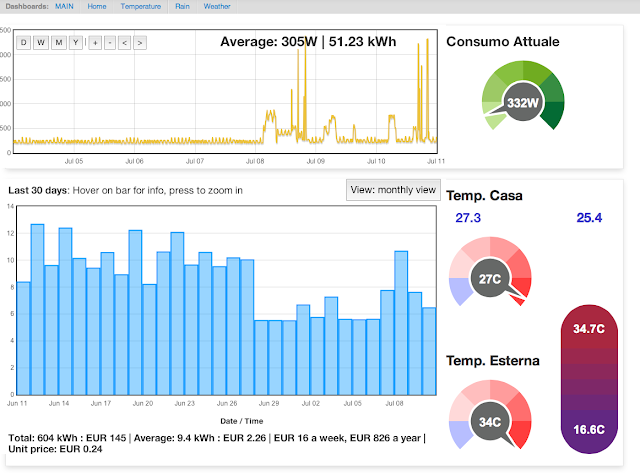
With all this in place I was able to configure the emoncms software to display this kind of data:
Energy consumption and temperature:
Weather data:
Energy consumption report:
All this information (except the weather graphs that use the wugraphs external tool) is logged graphed and displayed using emoncms.
Input nodes:
Feeds:
and these are the things I'm monitoring that can trigger various alerts:
All of this could never have happened without all the information and tools provided by the openenergymonitor guys, but I'm proud of the things I was able to add by myself (without getting electrocuted).
I'll try to follow up with some photos of the actual hardware in place.


Commenti
Posta un commento